False-colour astrophotography explained
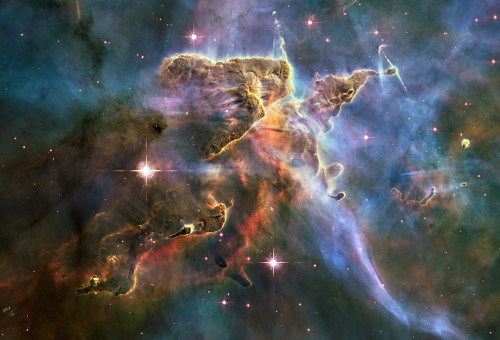
The Hubble Space Telescope captured this image of the Carina Nebula on February 1 and 2, 2010. The colours follow the so-called Hubble palette, which I describe later in this entry: red represents sulfur, green hydrogen and nitrogen, and blue oxygen. Image credit: NASA, ESA, and M. Livio and the Hubble 20th Anniversary Team (STScI).
Since this weekend marks the 20th anniversary of the launch of the Hubble telescope, I thought it would be worthwhile to explain the false-colour images taken by the Hubble’s cameras — why they’re in false colour, what the colours represent, and how it’s done. False-colour astrophotography is not unique to Hubble; it’s used at observatories on the ground around the world, and by professional and amateur astronomers alike. I could do it myself, down the road. So here’s my best stab at explaining it.
 But before we can explore what false colour is, and why astronomers use it, we need to explain what true colour is — and that requires us to talk a little bit about light.
Visible light represents only a small piece of the total electromagnetic spectrum, which ranges from from high-frequency, high-energy and short-wavelength gamma rays to low-frequency, long-wavelength and low-energy radio waves. Tucked between the ultraviolet and the infrared, visible light is, by definition, what part of the spectrum detectable by the human eye: wavelengths between about 380 nanometres (violet) and 760 nm (red) — or, to put it another way, frequencies between 400 terahertz (red) and 790 THz (violet). In a nutshell, each colour we perceive is simply light at a specific wavelength.
(For reasons that will become clear later on, I’m going to talk about wavelengths in nanometres, rather than frequencies in terahertz.)
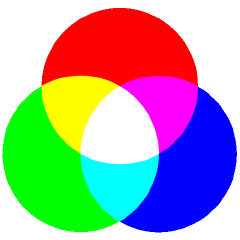 Now let’s jump to how computer screens and televisions display colour. I’ll skip over colour theory and the additive colour model and get to the point: the colours you see on your computer screen right now are a combination of red, green and blue (RGB). On most screens, each pixel has a red, green and blue colour channel, each with a value between 0 and 255 (or, if you’re a web designer and speak hexadecimal, between 00 and FF). If all three channels are set to zero, you’ve got black; if all three channels are set to 255, you’ve got white. Every other colour is a result of different values set for each channel.
False-colour imagery involves using one of those red, green or blue colour channels to express a wavelength of radiation that isn’t red, green or blue. In other words, what shows up as red on your screen might not be red in real life — it’s something else that we might not normally be able to see. What that something else is — that’s what’s interesting.
In astronomy, there are basically two kinds of false-colour images:
- Images that take electromagnetic radiation from outside the visible spectrum — such as ultraviolet and infrared — and map it to the red, green and blue colour channels.
- Images that take visible light in a very specific frequency, emitted by a specific element, and map that light to an entire red, green or blue colour channel.
Ultraviolet and infrared
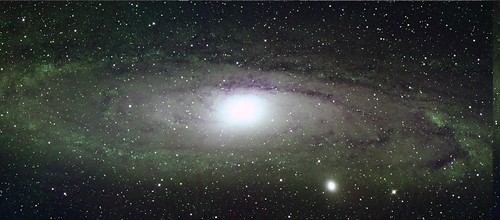
We’ll start with the first kind of false-colour image, which uses visible light to show something that isn’t in the visible part of the spectrum, and we’ll use M31, the Andromeda Galaxy, as our example. Here’s what it looks like in visible light:
And here it is in ultraviolet, in an image taken by the Ultraviolet/Optical Telescope aboard NASA’s Swift space observatory:
In this image, the red, green and blue channels have been replaced by specific ultraviolet wavelengths at 192.8, 224.6 and 260 nanometres — the middle to far ultraviolet, far beyond what even animals can see. Being able to see the ultraviolet allows astronomers to study star-formation processes; see NASA’s page on this image.
Other wavelengths are also possible. Here’s Andromeda in the infrared, showing the 24-micron (micrometre) wavelength:

This infrared wavelength is 32 times longer than the reddest red visible to the human eye.
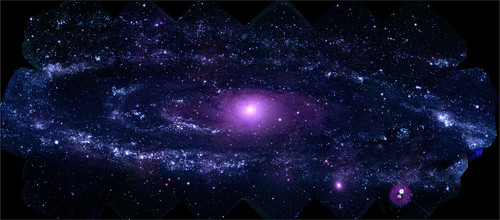
Now, you can create composite images as well. Let’s say you were to map the ultraviolet to the blue channel, and the infrared to the red channel. What would that look like? Something like this:

The upshot of all this is that there’s a lot more going on out there than in the narrow band of the spectrum that our eyes can see. Most non-visual wavelengths are blocked by the Earth’s atmosphere, so you need a space telescopes to observe in the gamma, X-ray, ultraviolet and portions of the infrared.

Narrowband
The other kind of false-colour astronomy images involves narrowband imagery. This involves light in the visual spectrum — this is light we can see, but it’s at specific wavelengths, each of which tells us a very interesting story.
Ionized atoms emit radiation in very specific wavelengths; when we detect light at a certain wavelength, we know that the element associated with that wavelength is present at that location. In a spectrum, this shows up as either an emission line or an absorption line. In this manner, astronomers can determine the chemical composition of stars and nebulae without ever having to go there.
This is particularly useful when taking pictures of nebulae, which are essentially large clouds of ionized gas, plasma and dust. Take a photo of that nebula through a narrowband filter — for example, one that eliminates all light except the oxygen-III emission line — and you will see the light from that nebula that is made by that element.
False-colour images of nebulae are essentially RGB images whose colour channels have been mapped to specific emission lines. In these images, each colour can represent a specific element. In other words, a false-colour image of a nebula tells us exactly what it’s made of.
There are many emission lines, but the three most commonly photographed by astronomers are hydrogen-alpha, oxygen-III and sulfur-II. Hydrogen-alpha (Hα) is often added to ordinary RGB images; it enhances the reds in images of hydrogen-rich emission nebulae, since its wavelength, 656.3 nm, is within the red part of the visual spectrum. Oxygen-III is particularly useful in planetary nebulae; at 500.7 nm, it’s in the green part. Sulfur-II, at 672.4 nm, is also red — and therein lies the problem.
| Element | Emission line | Wavelength | Colour |
|---|---|---|---|
| Hydrogen | Hα | 656.3 nm | Red |
| Oxygen | O-III | 500.7 nm | Green |
| Sulfur | S-II | 672.4 nm | Red |
Mapping Hα, O-III and S-II to red, green and blue is problematic when two of them are red, one is green and none is blue. Astronomers deal with this by using false colour — one or more of these elements is going to have to take a hit for the team and take on an unnatural hue.
Astroprof’s page on this subject details two different ways of using false colour when mapping these three emission lines to RGB. The Hubble palette assigns red to S-II, green to Hα, and blue to O-III: red is accurate, green and blue are false. Another scheme, the Canada-France-Hawaii Telescope (CFHT) system, assigns red to Hα, green to O-III, and blue to S-II — in this case, only the blue/sulfur channel is false.
| Red | Green | Blue | |
|---|---|---|---|
| True colour | Hα/S-II | O-III | |
| Hubble palette | S-II | Hα | O-III |
| CFHT | Hα | O-III | S-II |
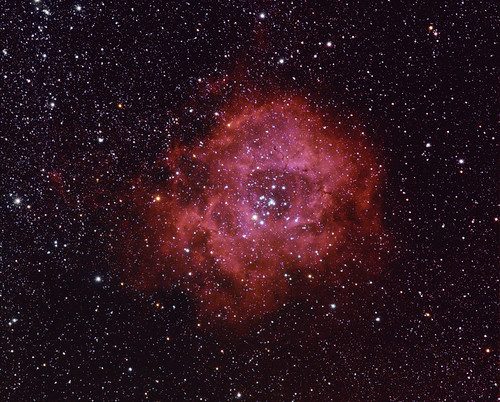
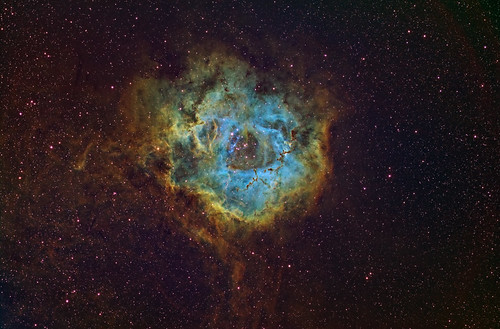
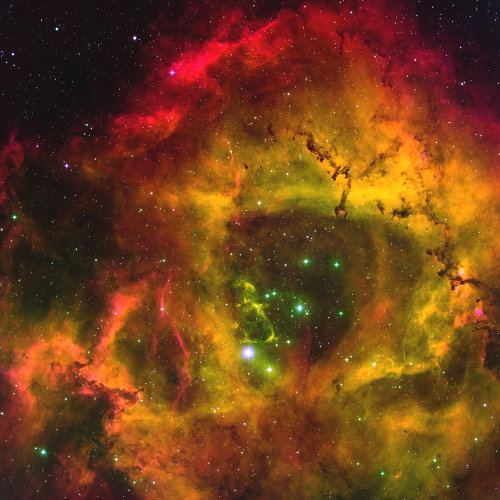
To demonstrate this, here are three images of the Rosette Nebula in Monoceros, an emission nebula that puts out a lot of light in the Hα band.
First, a full-spectrum image. Andrea Tosatto took this photo on February 2010, using a Canon digital SLR modified to be more sensitive to red light (which is useful for capturing that Hα light) and a telephoto lens:
Next, a narrowband image using the Hubble palette. Flickr user “astrorom” took this shot in January 2010, using a specialized astronomy camera, narrowband filters, and a four-inch Takahashi refractor:
And finally, an image of the Rosette that uses the CFHT palette, taken at the WIYN 0.9m Observatory on Kitt Peak:
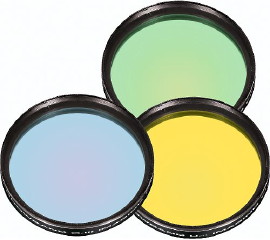 As you can see from astrorom’s photo, narrowband astrophotography isn’t limited to observatories. Not only can it be done from the ground, but it can be done by amateurs. Narrowband filters for the hydrogen-alpha, sulfur-II, and oxygen-III emission lines are widely available (for example, Orion sells a set
); you use them with a monochrome camera and take pictures, one filter at a time, one colour channel at a time, and then use software to combine them into a colour image. It’s exactly the same process the Hubble uses — and we can do it too.
The only question is, what palette will we use: Hubble or CFHT?
Further reading: The Meaning of Color in Hubble Images and Dear reddit: I’m tired of people bitching about the ‘fakeness’ of Hubble images (both via Kottke).
(Additional image credits: Andromeda Galaxy in visible light: Bill Schoening, Vanessa Harvey/REU program/NOAO/AURA/NSF. Andromeda in ultraviolet: NASA/Swift/Stefan Immler (GSFC) and Erin Grand (UMCP). Andromeda in infrared: NASA/JPL-Caltech/University of Arizona. Andromeda composite: NASA/JPL-Caltech. Rosette Nebula, full-spectrum: Andrea Tosatto, CC licence. Rosette Nebula, Hubble palette: astrorom, CC licence. Rosette Nebula, CFHT palette: T. A. Rector/University of Alaska Anchorage, WIYN and NOAO/AURA/NSF.)